Hi everyone, its Chu. I’ve asserted myself as the new Vice President of Data Analytics and Will has gifted me all the player performance data from 2014 through 2021. We're still working on data before 2014. I figured I would crunch the numbers and start my first of many blog posts to ask an easy question: Who is the best fantasy owner?
The method I chose was to take the percentage of points scored for that particular week. For example, if you scored 110 points and the sum of everyone's points was 1000 for that week, then you get 110/1000=11% as your weekly points. I chose this method because it controls for factors like rule changes (i.e. adding the super flex inflated points) and owners who haven’t played every year. Here's the graph:
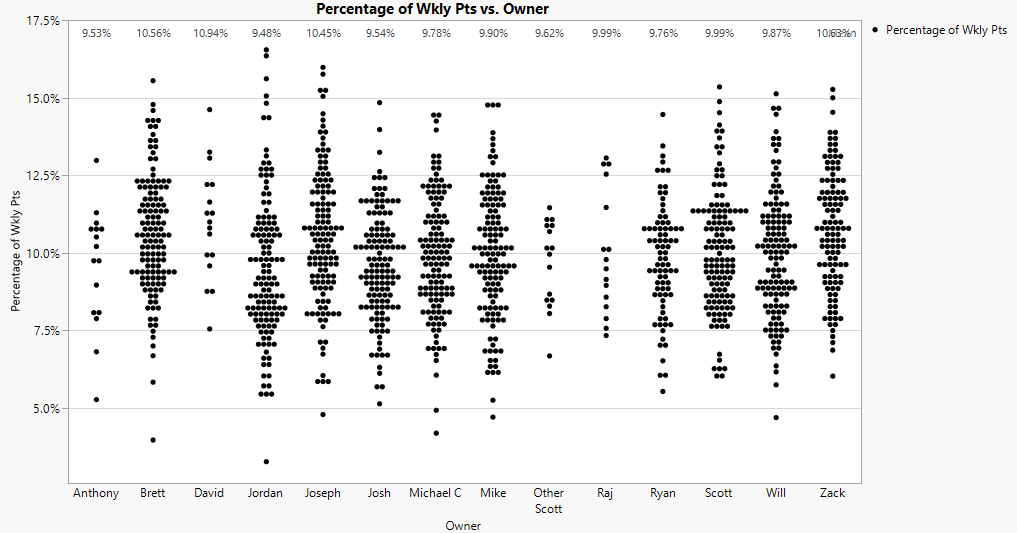
As a percent of the total week's points, its notable that Jordan has both the best (2014, Week 11) and worst week (2016, Week 15).
The summary in table form is below. The first table is all owners and the second table is just the core 9 owners.
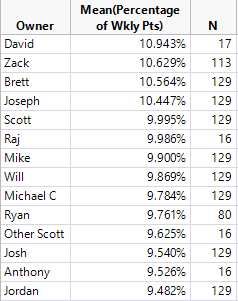
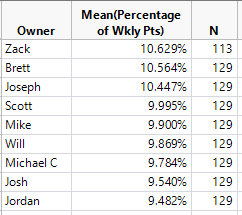
I started to do significance testing to see if people were actually better than others or could it just be chance. The answer is yes, some people are better. I only included analysis of the core 9 owners. It divides us into tiers:
- Tier 1: Zack, Brett
- Tier 2: Joe
- Tier 3: Scott
- Tier 4: Mike, Will, Michael C, Josh
- Tier 5: Jordan
WARNING: TECHNICAL INFO BELOW
These tiers are just rough guidelines. To get one level deeper, the full glory of the t-tests can be seen in this confusing image below. The analysis does a head-to-head comparison of all owners against each other and determines if their scores are significantly different from each other.
The 1st column is the owner who has scored more amongst the two. The color of the line on the left shows the confidence level that the 1st owner is better than the 2nd owner. Green is very confident (>95%), yellow is moderately confident (80-95%), orange is mildly confident (60-80%), and red means the confidence is low (<60%).
The p-value (right column) shows the inverse of the confidence level. For example, about halfway down, you can see the Scott vs Josh comparison in a red box. The p-value of 0.0722 means that there’s a 92.78% chance that Scott’s weekly scores are higher than Josh’s, but there’s also a 7.22% chance that they aren’t statistically different at all. This is in the "moderately confident" category.
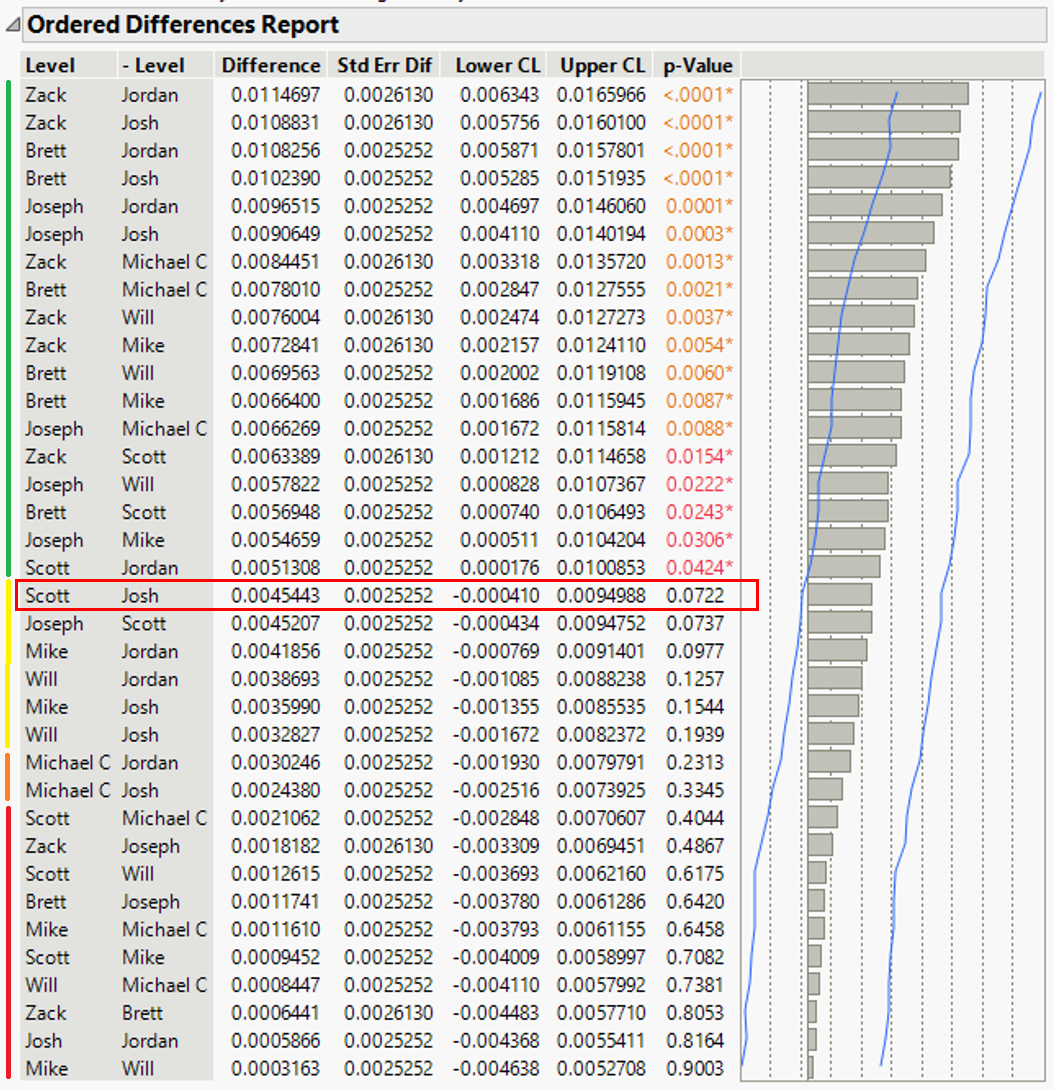
In our future trash talk, you can always refer to this, but I ask that you use the right terminology. You can’t say “I’m better than you”, but, for example, Scott can say to Josh, “I’m 92.78% sure that I’m better than you.”
As required by my boss, I'm obligated to say that data only goes to 2014. The data prior to that is still being worked on, so I'll update this analysis once that data is in.
Feel free to send me suggestions for future week’s topics!
Good luck this weekend and I’ll talk to you next week.