I'm back with updated data all the way to 2006. Most of this article will be the same as what was posted 2 days earlier with the same explanations to the same graphs and images, but with the updated data. I also added more explanation in the section discussing the tiers.
Who is the best fantasy owner?
The method I chose was to take the percentage of points scored for that particular week. For example, if you scored 110 points and the sum of everyone's points was 1000 for that week, then you get 110/1000=11% as your weekly points. I chose this method because it controls for factors like rule changes (i.e. adding the super flex inflated points) and owners who haven’t played every year. Here's the graph:
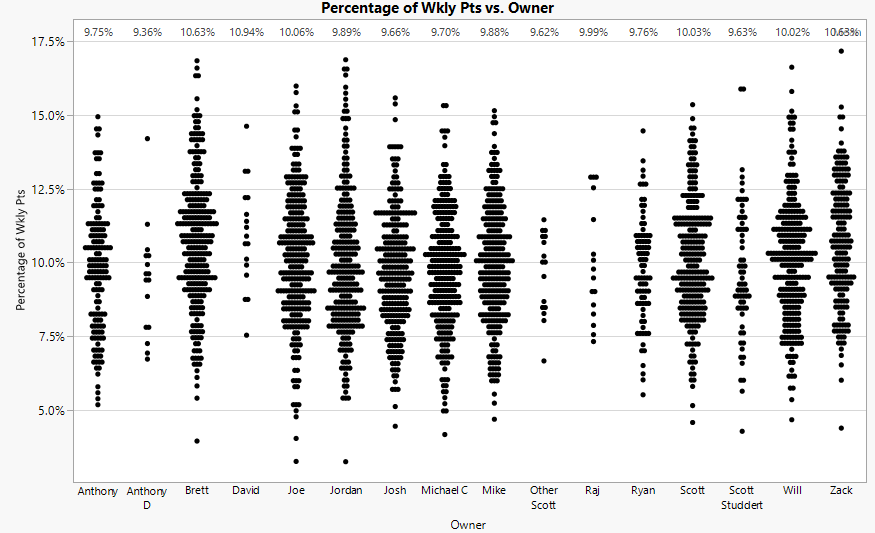
Points Scored for each week, expressed as the percentage of points scored that week
As a percent of the total week's points, Zack has the highest with 17.16% on Week 11 of 2006 and Jordan has the lowest with 3.26% on Week 15 of 2016.
Note: Yes, your consolation bracket games and people playing in the 3rd or 5th place games are included in this data set.
The summary in table form is below. The first table is all owners and the second table is just the core 9 owners.
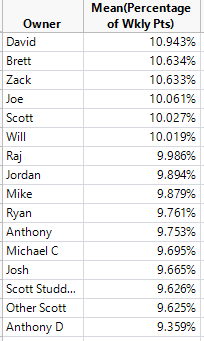
Highest to lowest average points scored per week
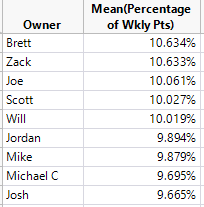
Highest to lowest average points scored per week (core 9 owners only)
WARNING: TECHNICAL INFO BELOW
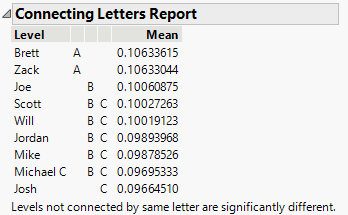
I started to do significance testing to see if people were actually better than others or could it just be chance. The answer is yes, some people are better. I only included analysis of the core 9 owners. It divides us into 4 tiers:
- Tier A: Zack, Brett
- Tier B: Joe
- Tier BC: Scott, Will, Jordan, Mike, Michael C
- Tier C: Josh
The first thing you're probably thinking is why I used A, B, BC, and C to describe the tiers instead of 1, 2, 3, and 4. I'll get to that.
The way that these tiers are calculated are based on who you are significantly different from. The threshold is 95% confidence, which is a fairly high bar to cross, is why more than half the league is considered not statistically different from each other. If you share the same letter as someone else, then you and that person have not crossed the 95% confidence threshold to say that one is better than the other. So for example, Josh in Tier C is actually not significantly different from anyone in Tier BC. He is, however, significantly different from Joe in Tier B. This is shown in the screenshot below in what's called a Connecting Letters Report.
To get one level deeper, the full glory of the t-tests can be seen in this confusing image below. The analysis does a head-to-head comparison of all owners against each other and determines if their scores are significantly different from each other. The 1st column is the owner who has scored more amongst the two.
The p-value (right column) shows the inverse of the confidence level. For example, about halfway down, you can see the Scott vs Josh comparison in a red box. The p-value of 0.0574 means that there’s a 94.26% chance that Scott’s weekly scores are truly higher than Josh’s, but there’s also a 5.74% chance that the observed difference is due to random chance. This just barely came up short to the 95% confidence level to put Scott into a different tier than Josh which is why Scott was in Tier BC and Josh is in Tier C.
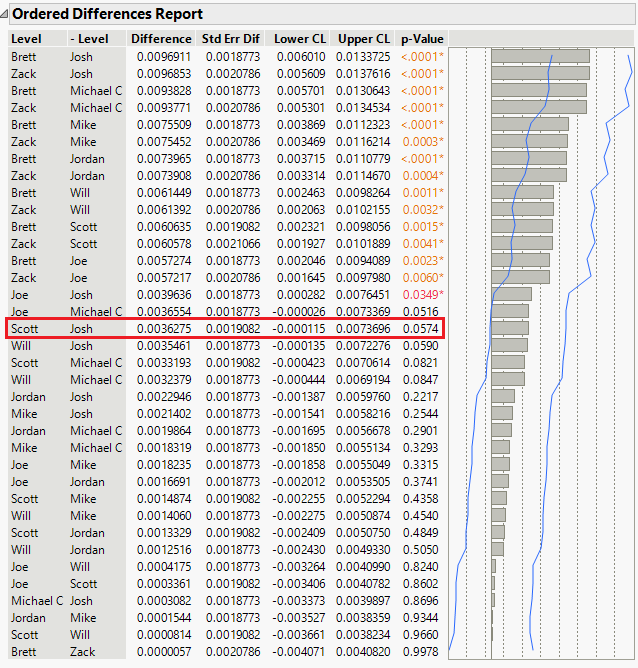
In our future trash talk, you can always refer to this, but I ask that you use the right terminology. You can’t say “I’m better than you”, but, for example, Scott can say to Josh, “I’m 94.26% sure that I’m better than you.”
Feel free to send me suggestions for future week’s topics!