Brett wanted to know if his team was a "playoff" team. What's the typical cutoff of a playoff team and a non-playoff team? Let's find out. I'll start with the summary and go into the details later.
Here's the graph which shows playoff probability with points scored over the regular season. Here's some percentages of making the playoffs based on score:
- If your team scores 1800, then you have a 25% chance of making the playoffs.
- If your team scores 1885, then you have a 50% chance of making the playoffs.
- If your team scores 1960, then you have a 75% chance of making the playoffs.
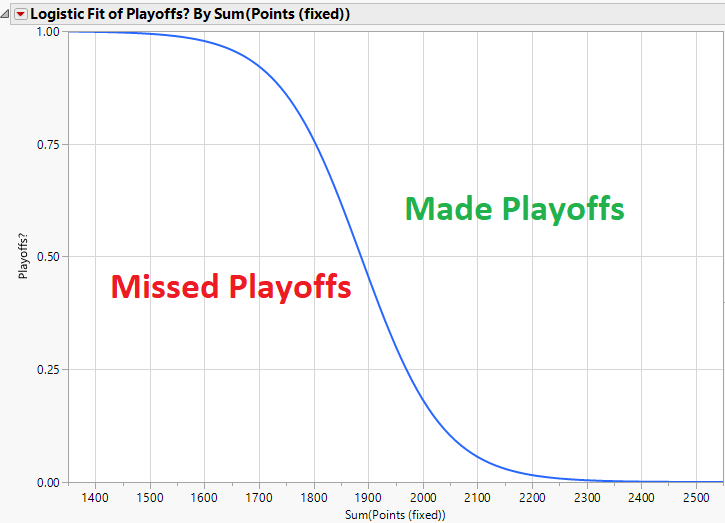
Probability of Making/Missing the playoffs based on points scored over the regular season
Here's the same playoff probability graph, but with wins in the X-axis instead of points scored.
- With 5 wins, your chance of making the playoffs is about 3%
- With 6 wins, your chance of making the playoffs is about 30%
- With 7 wins, your chance of making the playoffs is about 88%
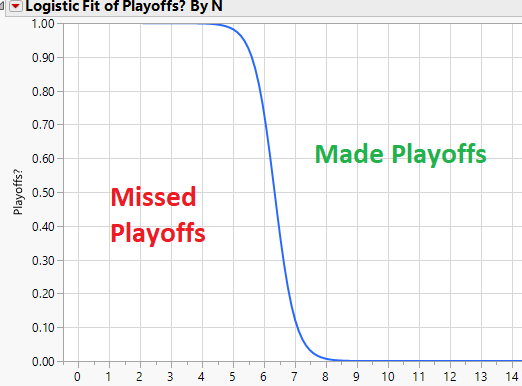
Probability of Making/Missing the playoffs based on number of wins over the regular season
tldr: Brett, get 7 wins and hope
Now here's the part about how I explain how I did this. I decided to simulate 1000 seasons with 14-weeks each, superflex rules, and 10-team league. I needed to figure out how to assign owners' weekly points based on what closely matches the historical data. The historical data is our own league data since 2018 when we implemented superflex. I can easily figure out the average and standard deviation of the weekly scores, but I need to make some owners better than others. This allows bad teams to be more likely to have bad scores and good teams to be more likely to have good scores (#protip). I ultimately decided that the worst team will have, on average, 30 points less than the best team. All 10 teams had a modifier placed on their average score to indicate their skill level. The modifiers are evenly distributed between +15 and -15. They are: +15, +11.6, +8.3, +5, +1.6 and all the negatives of those numbers. That doesn't mean the team with a -15 modifier will always lose, the standard deviation of scores is very high (~29) which means that bad teams can still win on any given week.
The reason why I picked 30 is so that the standard deviation of a season's worth of scores matched closely to the historical data. I brute force tried as high as 45 and as low as 22, but 30 came close to matching the actual data since 2018.
Here's the graph of the weekly scores of the simulation on the left and actual data on the right. They match pretty closely.
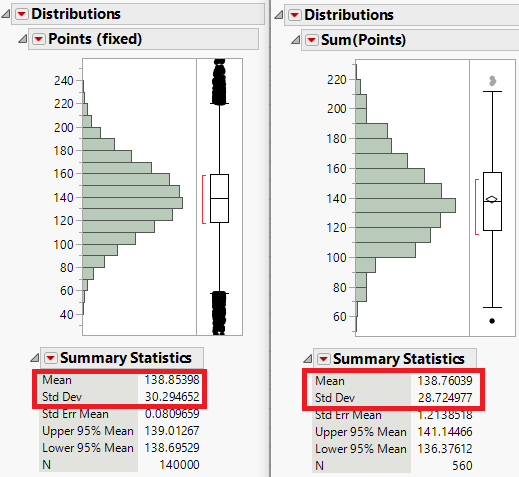
Comparison of simulated scores in each week on the left and actual data on the right
Now here's a graph of the yearly scores of the simulation on the left and actual data on the right. They also match pretty closely.
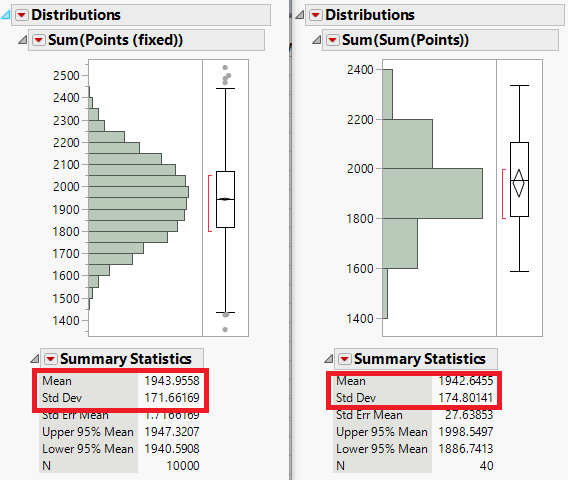
Comparison of simulated scores over the regular season on the left and actual data on the right
Once I simulated everyone's points for a particular week, I randomly assigned matchups to give everyone a win or loss for every week. Then, I ranked all teams within each "season" based on wins/loss (total points to break ties) from 1 to 10 to determine if teams made the playoffs or not. The end result is the 2 graphs at the very top to show the probability of making the playoffs versus points scored or wins over the whole season.